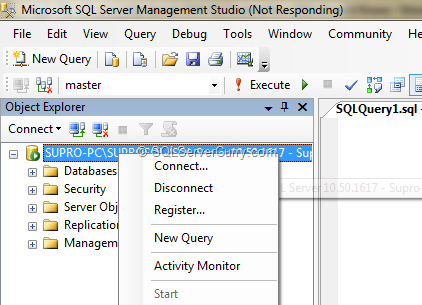
To view Activity Monitor in SQL Server 2008, right-click the instance name and choose Activity Monitor or click the Activity Monitor icon on the standard toolbar.

In SQL Server 2005, Activity Monitor can be viewed in SSMS by connecting to the server with Object Explorer, expanding ‘Management’, and then double-click ‘Activity Monitor’.
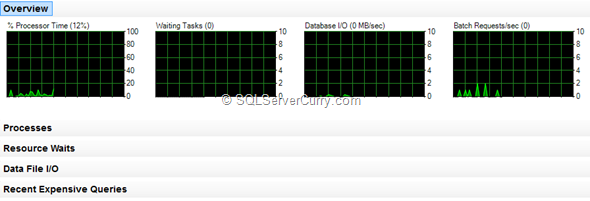
Once opened, the Activity Monitor Dashboard View contains four graphs which can help identity any abnormal activity in the Database. The graphs include % Processor Time (SQL Server), Waiting Tasks, Database I/O and Batch Requests. The default graph refresh rate is 10 seconds, but you change that easily by right-clicking any of the four graphs and selecting the appropriate refresh interval.
This snapshot is very helpful to get a quick performance snapshot without the need to use other monitoring tool for the same purpose.

This dashboard also contains expandable/collapsible panes to view detailed information about Processes, Resources, I/O and Expensive Queries. Just click on the expand button to the right of each pane to view the detailed information. Here’s a quick overview of the different graphs and what they show.
- Processor Time - The percentage of elapsed time that the processor spends to execute non-idle threads for the instance across all CPUs. The Processes pane gives information on what processes are running, what resources are being utilized etc. You can even right-click a process and choose Trace Process in SQL Server Profiler. Presto!
- Waiting Tasks - The number of tasks that are waiting for processor, I/O, or memory resources. The Resource Waits pane details the processes waiting for other resources on the server. It shows the latest information from several DMVs like the sys.dm_os_wait_stats
- Database I/O – Information on data and log files for system and user databases. Provides the transfer rate in MB/Sec, of data from memory to disk, disk to memory, or disk to disk. The pane contains information to quickly detect a contention in disk I/O.
- Batch Requests/sec - The number of SQL Server batches that are received by the instance. The Expensive Query pane lets you find and tune expensive queries. You can even right-click any query and view its graphical execution plan. Also see Find the Most Time Consuming Code in your SQL Server Database
Note: To view the Activity Monitor in SQL Server, a user must have VIEW SERVER STATE permission. Also make sure you close the Activity Monitor tool in SSMS when it is not required.
No comments:
Post a Comment